


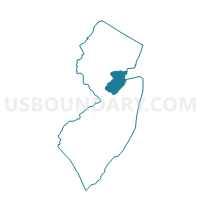
Middlesex County, New Jersey
About
Outline

Summary
| Unique Area Identifier | 122130 |
| Name | Middlesex County |
| State | New Jersey |
| Area (square miles) | 322.83 |
| Land Area (square miles) | 308.91 |
| Water Area (square miles) | 13.91 |
| % of Land Area | 95.69 |
| % of Water Area | 4.31 |
| Latitude of the Internal Point | 40.43959250 |
| Longtitude of the Internal Point | -74.40758520 |
| Total Population | 809,858 |
| Total Housing Units | 294,800 |
| Total Households | 281,186 |
| Median Age | 37.2 |
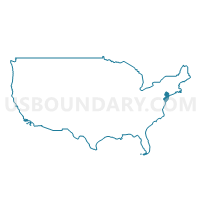
Maps
Graphs
Select a template below for downloading or customizing gragh for Middlesex County, New Jersey


Neighbors
Neighoring County (by Name) Neighboring County on the Map
County Subdivision in Middlesex County (by Name) Neighboring County Subdivision on the Map
- Carteret borough, Middlesex County, NJ
- Cranbury township, Middlesex County, NJ
- Dunellen borough, Middlesex County, NJ
- East Brunswick township, Middlesex County, NJ
- Edison township, Middlesex County, NJ
- Helmetta borough, Middlesex County, NJ
- Highland Park borough, Middlesex County, NJ
- Jamesburg borough, Middlesex County, NJ
- Metuchen borough, Middlesex County, NJ
- Middlesex borough, Middlesex County, NJ
- Milltown borough, Middlesex County, NJ
- Monroe township, Middlesex County, NJ
- New Brunswick city, Middlesex County, NJ
- North Brunswick township, Middlesex County, NJ
- Old Bridge township, Middlesex County, NJ
- Perth Amboy city, Middlesex County, NJ
- Piscataway township, Middlesex County, NJ
- Plainsboro township, Middlesex County, NJ
- Sayreville borough, Middlesex County, NJ
- South Amboy city, Middlesex County, NJ
- South Brunswick township, Middlesex County, NJ
- South Plainfield borough, Middlesex County, NJ
- South River borough, Middlesex County, NJ
- Spotswood borough, Middlesex County, NJ
- Woodbridge township, Middlesex County, NJ
Top 10 Neighboring Place (by Population) Neighboring Place on the Map
- New York city, NY (8,175,133)
- New Brunswick city, NJ (55,181)
- Perth Amboy city, NJ (50,814)
- Plainfield city, NJ (49,808)
- Sayreville borough, NJ (42,704)
- Linden city, NJ (40,499)
- Rahway city, NJ (27,346)
- Old Bridge CDP, NJ (23,753)
- South Plainfield borough, NJ (23,385)
- Carteret borough, NJ (22,844)
Top 10 Neighboring Elementary School District (by Population) Neighboring Elementary School District on the Map
- Manalapan-Englishtown Regional School District, NJ (40,719)
- Marlboro Township School District, NJ (40,191)
- Millstone Township School District, NJ (10,566)
- Milltown Borough School District, NJ (6,893)
- Jamesburg Borough School District, NJ (5,915)
- South Bound Brook Borough School District, NJ (4,563)
- Cranbury Township School District, NJ (3,857)
Top 10 Neighboring Secondary School District (by Population) Neighboring Secondary School District on the Map
Top 10 Neighboring Unified School District (by Population) Neighboring Unified School District on the Map
- New York City Department Of Education, NY (8,175,133)
- Edison Township School District, NJ (99,967)
- Woodbridge Township School District, NJ (99,585)
- Old Bridge Township School District, NJ (65,375)
- Franklin Township School District, NJ (62,300)
- Piscataway Township School District, NJ (56,044)
- New Brunswick City School District, NJ (55,181)
- Bridgewater-Raritan Regional School District, NJ (51,345)
- Perth Amboy City School District, NJ (50,814)
- West Windsor-Plainsboro Regional School District, NJ (50,164)
Top 10 Neighboring State Legislative District Lower Chamber (by Population) Neighboring State Legislative District Lower Chamber on the Map
- General Assembly District 12, NJ (235,457)
- General Assembly District 17, NJ (235,142)
- General Assembly District 14, NJ (230,937)
- General Assembly District 19, NJ (224,578)
- General Assembly District 13, NJ (219,626)
- General Assembly District 16, NJ (215,874)
- General Assembly District 22, NJ (214,711)
- General Assembly District 18, NJ (210,881)
- General Assembly District 15, NJ (204,558)
- Assembly District 62, NY (127,763)
Top 10 Neighboring State Legislative District Upper Chamber (by Population) Neighboring State Legislative District Upper Chamber on the Map
- State Senate District 24, NY (320,917)
- State Senate District 12, NJ (235,457)
- State Senate District 17, NJ (235,142)
- State Senate District 14, NJ (230,937)
- State Senate District 19, NJ (224,578)
- State Senate District 13, NJ (219,626)
- State Senate District 16, NJ (215,874)
- State Senate District 22, NJ (214,711)
- State Senate District 18, NJ (210,881)
- State Senate District 15, NJ (204,558)
Top 10 Neighboring 111th Congressional District (by Population) Neighboring 111th Congressional District on the Map
- Congressional District 4, NJ (724,596)
- Congressional District 12, NJ (701,881)
- Congressional District 13, NY (686,525)
- Congressional District 13, NJ (684,965)
- Congressional District 7, NJ (672,885)
- Congressional District 6, NJ (668,806)
- Congressional District 10, NJ (634,343)
Top 10 Census Tract in Middlesex County (by Population) Neighboring Census Tract on the Map
- Census Tract 82.08, Middlesex County, NJ (12,035)
- Census Tract 82.02, Middlesex County, NJ (10,526)
- Census Tract 62.03, Middlesex County, NJ (10,203)
- Census Tract 88, Middlesex County, NJ (8,734)
- Census Tract 85.03, Middlesex County, NJ (8,375)
- Census Tract 14.16, Middlesex County, NJ (8,140)
- Census Tract 79.12, Middlesex County, NJ (7,838)
- Census Tract 70, Middlesex County, NJ (7,691)
- Census Tract 56.02, Middlesex County, NJ (7,686)
- Census Tract 6.06, Middlesex County, NJ (7,631)
Top 10 Neighboring 5-Digit ZIP Code Tabulation Area (by Population) Neighboring 5-Digit ZIP Code Tabulation Area on the Map
- 08854, NJ (55,961)
- 08901, NJ (55,223)
- 08861, NJ (53,099)
- 08873, NJ (49,921)
- 08540, NJ (47,115)
- 08816, NJ (46,298)
- 08831, NJ (45,620)
- 07060, NJ (44,998)
- 08817, NJ (44,621)
- 07726, NJ (42,508)
Data
Demographic, Population, Households, and Housing Units
** Data sources from census 2010 **
Show Data on Map
Download Full List as CSV
Download Quick Sheet as CSV
| Subject | This Area | New Jersey | National |
|---|---|---|---|
| POPULATION | |||
| Total Population Map | 809,858 | 8,791,894 | 308,745,538 |
| POPULATION, HISPANIC OR LATINO ORIGIN | |||
| Not Hispanic or Latino Map | 660,883 | 7,236,750 | 258,267,944 |
| Hispanic or Latino Map | 148,975 | 1,555,144 | 50,477,594 |
| POPULATION, RACE | |||
| White alone Map | 474,589 | 6,029,248 | 223,553,265 |
| Black or African American alone Map | 78,462 | 1,204,826 | 38,929,319 |
| American Indian and Alaska Native alone Map | 2,777 | 29,026 | 2,932,248 |
| Asian alone Map | 173,293 | 725,726 | 14,674,252 |
| Native Hawaiian and Other Pacific Islander alone Map | 251 | 3,043 | 540,013 |
| Some Other Race alone Map | 56,569 | 559,722 | 19,107,368 |
| Two or More Races Map | 23,917 | 240,303 | 9,009,073 |
| POPULATION, SEX | |||
| Male Map | 397,485 | 4,279,600 | 151,781,326 |
| Female Map | 412,373 | 4,512,294 | 156,964,212 |
| POPULATION, AGE (18 YEARS) | |||
| 18 years and over Map | 624,401 | 6,726,680 | 234,564,071 |
| Under 18 years | 185,457 | 2,065,214 | 74,181,467 |
| POPULATION, AGE | |||
| Under 5 years | 50,006 | 541,020 | 20,201,362 |
| 5 to 9 years | 51,052 | 564,750 | 20,348,657 |
| 10 to 14 years | 51,542 | 587,335 | 20,677,194 |
| 15 to 17 years | 32,857 | 372,109 | 12,954,254 |
| 18 and 19 years | 24,769 | 225,990 | 9,086,089 |
| 20 years | 12,746 | 108,760 | 4,519,129 |
| 21 years | 12,402 | 106,219 | 4,354,294 |
| 22 to 24 years | 32,969 | 326,259 | 12,712,576 |
| 25 to 29 years | 54,303 | 553,139 | 21,101,849 |
| 30 to 34 years | 57,274 | 556,662 | 19,962,099 |
| 35 to 39 years | 58,306 | 588,379 | 20,179,642 |
| 40 to 44 years | 59,209 | 649,918 | 20,890,964 |
| 45 to 49 years | 62,102 | 704,516 | 22,708,591 |
| 50 to 54 years | 59,822 | 674,680 | 22,298,125 |
| 55 to 59 years | 50,297 | 565,623 | 19,664,805 |
| 60 and 61 years | 17,267 | 201,084 | 7,113,727 |
| 62 to 64 years | 23,473 | 279,458 | 9,704,197 |
| 65 and 66 years | 12,458 | 149,028 | 5,319,902 |
| 67 to 69 years | 16,629 | 201,944 | 7,115,361 |
| 70 to 74 years | 21,645 | 260,462 | 9,278,166 |
| 75 to 79 years | 18,391 | 215,715 | 7,317,795 |
| 80 to 84 years | 15,466 | 179,233 | 5,743,327 |
| 85 years and over | 14,873 | 179,611 | 5,493,433 |
| MEDIAN AGE BY SEX | |||
| Both sexes Map | 37.20 | 39.00 | 37.20 |
| Male Map | 36.00 | 37.40 | 35.80 |
| Female Map | 38.40 | 40.30 | 38.50 |
| HOUSEHOLDS | |||
| Total Households Map | 281,186 | 3,214,360 | 116,716,292 |
| HOUSEHOLDS, HOUSEHOLD TYPE | |||
| Family households: Map | 202,954 | 2,226,606 | 77,538,296 |
| Husband-wife family Map | 157,214 | 1,643,377 | 56,510,377 |
| Other family: Map | 45,740 | 583,229 | 21,027,919 |
| Male householder, no wife present Map | 12,638 | 154,134 | 5,777,570 |
| Female householder, no husband present Map | 33,102 | 429,095 | 15,250,349 |
| Nonfamily households: Map | 78,232 | 987,754 | 39,177,996 |
| Householder living alone Map | 63,150 | 811,221 | 31,204,909 |
| Householder not living alone Map | 15,082 | 176,533 | 7,973,087 |
| HOUSEHOLDS, HISPANIC OR LATINO ORIGIN OF HOUSEHOLDER | |||
| Not Hispanic or Latino householder: Map | 242,488 | 2,777,617 | 103,254,926 |
| Hispanic or Latino householder: Map | 38,698 | 436,743 | 13,461,366 |
| HOUSEHOLDS, RACE OF HOUSEHOLDER | |||
| Householder who is White alone | 182,696 | 2,340,060 | 89,754,352 |
| Householder who is Black or African American alone | 27,228 | 428,304 | 14,129,983 |
| Householder who is American Indian and Alaska Native alone | 620 | 8,686 | 939,707 |
| Householder who is Asian alone | 50,591 | 223,319 | 4,632,164 |
| Householder who is Native Hawaiian and Other Pacific Islander alone | 57 | 925 | 143,932 |
| Householder who is Some Other Race alone | 14,157 | 152,495 | 4,916,427 |
| Householder who is Two or More Races | 5,837 | 60,571 | 2,199,727 |
| HOUSEHOLDS, HOUSEHOLD TYPE BY HOUSEHOLD SIZE | |||
| Family households: Map | 202,954 | 2,226,606 | 77,538,296 |
| 2-person household Map | 68,305 | 812,884 | 31,882,616 |
| 3-person household Map | 51,104 | 539,679 | 17,765,829 |
| 4-person household Map | 48,844 | 498,316 | 15,214,075 |
| 5-person household Map | 20,471 | 228,492 | 7,411,997 |
| 6-person household Map | 8,313 | 86,142 | 3,026,278 |
| 7-or-more-person household Map | 5,917 | 61,093 | 2,237,501 |
| Nonfamily households: Map | 78,232 | 987,754 | 39,177,996 |
| 1-person household Map | 63,150 | 811,221 | 31,204,909 |
| 2-person household Map | 11,378 | 144,798 | 6,360,012 |
| 3-person household Map | 1,881 | 18,350 | 992,156 |
| 4-person household Map | 918 | 7,791 | 411,171 |
| 5-person household Map | 440 | 3,235 | 126,634 |
| 6-person household Map | 232 | 1,302 | 48,421 |
| 7-or-more-person household Map | 233 | 1,057 | 34,693 |
| HOUSING UNITS | |||
| Total Housing Units Map | 294,800 | 3,553,562 | 131,704,730 |
| HOUSING UNITS, OCCUPANCY STATUS | |||
| Occupied Map | 281,186 | 3,214,360 | 116,716,292 |
| Vacant Map | 13,614 | 339,202 | 14,988,438 |
| HOUSING UNITS, OCCUPIED, TENURE | |||
| Owned with a mortgage or a loan Map | 136,540 | 1,532,012 | 52,979,430 |
| Owned free and clear Map | 50,607 | 570,453 | 23,006,644 |
| Renter occupied Map | 94,039 | 1,111,895 | 40,730,218 |
| HOUSING UNITS, VACANT, VACANCY STATUS | |||
| For rent Map | 5,303 | 92,118 | 4,137,567 |
| Rented, not occupied Map | 281 | 4,578 | 206,825 |
| For sale only Map | 2,719 | 39,260 | 1,896,796 |
| Sold, not occupied Map | 601 | 8,145 | 421,032 |
| For seasonal, recreational, or occasional use Map | 1,244 | 134,903 | 4,649,298 |
| For migrant workers Map | 4 | 156 | 24,161 |
| Other vacant Map | 3,462 | 60,042 | 3,652,759 |
| HOUSING UNITS, OCCUPIED, AVERAGE HOUSEHOLD SIZE BY TENURE | |||
| Total: Map | 2.80 | 2.68 | 2.58 |
| Owner occupied Map | 2.89 | 2.79 | 2.65 |
| Renter occupied Map | 2.61 | 2.47 | 2.44 |
| HOUSING UNITS, OCCUPIED, TENURE BY RACE OF HOUSEHOLDER | |||
| Owner occupied: Map | 187,147 | 2,102,465 | 75,986,074 |
| Householder who is White alone Map | 135,358 | 1,717,602 | 63,446,275 |
| Householder who is Black or African American alone Map | 12,473 | 171,748 | 6,261,464 |
| Householder who is American Indian and Alaska Native alone Map | 241 | 3,523 | 509,588 |
| Householder who is Asian alone Map | 31,196 | 137,287 | 2,688,861 |
| Householder who is Native Hawaiian and Other Pacific Islander alone Map | 31 | 375 | 61,911 |
| Householder who is Some Other Race alone Map | 4,850 | 45,382 | 1,975,817 |
| Householder who is Two or More Races Map | 2,998 | 26,548 | 1,042,158 |
| Renter occupied: Map | 94,039 | 1,111,895 | 40,730,218 |
| Householder who is White alone Map | 47,338 | 622,458 | 26,308,077 |
| Householder who is Black or African American alone Map | 14,755 | 256,556 | 7,868,519 |
| Householder who is American Indian and Alaska Native alone Map | 379 | 5,163 | 430,119 |
| Householder who is Asian alone Map | 19,395 | 86,032 | 1,943,303 |
| Householder who is Native Hawaiian and Other Pacific Islander alone Map | 26 | 550 | 82,021 |
| Householder who is Some Other Race alone Map | 9,307 | 107,113 | 2,940,610 |
| Householder who is Two or More Races Map | 2,839 | 34,023 | 1,157,569 |
| HOUSING UNITS, OCCUPIED, TENURE BY HISPANIC OR LATINO ORIGIN OF HOUSEHOLDER | |||
| Owner occupied: Map | 187,147 | 2,102,465 | 75,986,074 |
| Not Hispanic or Latino householder Map | 170,384 | 1,943,837 | 69,617,625 |
| Hispanic or Latino householder Map | 16,763 | 158,628 | 6,368,449 |
| Renter occupied: Map | 94,039 | 1,111,895 | 40,730,218 |
| Not Hispanic or Latino householder Map | 72,104 | 833,780 | 33,637,301 |
| Hispanic or Latino householder Map | 21,935 | 278,115 | 7,092,917 |
| HOUSING UNITS, OCCUPIED, TENURE BY HOUSEHOLD SIZE | |||
| Owner occupied: Map | 187,147 | 2,102,465 | 75,986,074 |
| 1-person household Map | 34,283 | 418,027 | 16,453,569 |
| 2-person household Map | 55,444 | 671,621 | 27,618,605 |
| 3-person household Map | 35,833 | 378,218 | 12,517,563 |
| 4-person household Map | 36,791 | 373,606 | 10,998,793 |
| 5-person household Map | 15,200 | 166,068 | 5,057,765 |
| 6-person household Map | 5,988 | 58,752 | 1,965,796 |
| 7-or-more-person household Map | 3,608 | 36,173 | 1,373,983 |
| Renter occupied: Map | 94,039 | 1,111,895 | 40,730,218 |
| 1-person household Map | 28,867 | 393,194 | 14,751,340 |
| 2-person household Map | 24,239 | 286,061 | 10,624,023 |
| 3-person household Map | 17,152 | 179,811 | 6,240,422 |
| 4-person household Map | 12,971 | 132,501 | 4,626,453 |
| 5-person household Map | 5,711 | 65,659 | 2,480,866 |
| 6-person household Map | 2,557 | 28,692 | 1,108,903 |
| 7-or-more-person household Map | 2,542 | 25,977 | 898,211 |
Loading...